It doesn't matter what happened last year or what could happen next year…
For professional traders, the only time frame that matters is January 1 to December 31. You have 250 trading days to perform.
This time frame determines whether traders get paid or not. For some, it determines whether they keep their job or not.
It's a tough business…
December usually marks an exciting period because traders are either aggressively chasing performance or, on the opposite side of the spectrum, they are drastically reducing risk into the end of the year.
This back-and-forth between aggressive and risk-averse behavior creates a lot of activity – and a lot of opportunity to close out the year.
As we step into December, I'm going to show you two tech-focused parts of the market that I'm watching right now… and some of the signals I'm using to plan my trades from here.
[Breakthrough: Warren Buffett made $12 billion with the idea behind this simple technique]
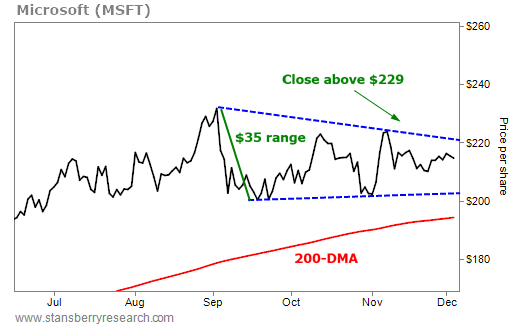
Since early September, I've been watching big technology companies like Microsoft (MSFT) trade in a sideways consolidation pattern. I believe this is a big correction that could end soon.
Take a look at the chart below…
You may not be familiar with technical analysis. But this is a simple idea. The blue lines show the pattern of the correction since September… trading within a $35 price range.
A couple things could happen from here. The bullish scenario is that the most recent dips marked a low near $210 and MSFT is ready to rally. A close above $229 or $230 – right around the recent high – will signal that the stock is out of this correction.
If that happens, the stock should keep rising to at least $265. I calculated this target by using basic technical analysis – taking the widest part of this correction range ($35) and adding that to the breakout level of $230.
If there is more downside and the lower level of this corrective pattern in blue breaks below $200, this will cause a lot of sell stops to trigger… But this will also create oversold conditions. When too many traders are selling at once, it's usually a sign that a reversal is coming.
[Alert: Look at this RARE 5100% Chart!]
We can expect that floor to form around MSFT's 200-day moving average (“200-DMA”), marked on the chart above in red. This is simply the measure of a stock's long-term trend. And in this case, it's right around $190 – which means $190 is a level to buy for at least a short-term bounce.
Either outcome should lead to a great opportunity to get in. Whether we get a breakout or a breakdown in the weeks ahead, I'm looking for spots to open trades in MSFT.
Another strong-trending stock right now is mobile-payments company Square (SQ)…
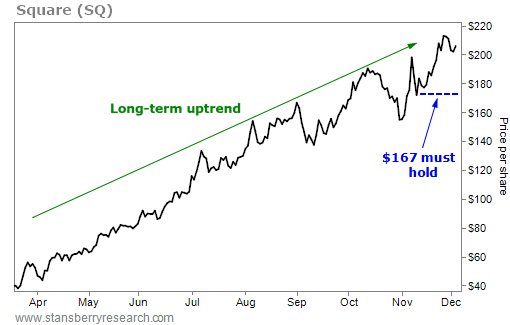
I recently showed my Ten Stock Trader readers some important levels in this stock. Take a look at the strong rally below…
Much of this long-term uptrend in green (not all, but some) is due to Square's connection with bitcoin. The company has invested in the cryptocurrency recently. And as of this summer, its customers can even buy bitcoin through the Square platform.
I don't get as excited (“Bitcoin is going to $1,000,000!”) or as apocalyptic (“Bitcoin is a Ponzi scheme that's going to zero!”) as some people when it comes to bitcoin and cryptocurrencies… It's just another market to trade.
Square's epic rise was tough to trade for a while, as the move was straight up. But the stock recently experienced some volatility. So we finally have some technical-analysis levels to work with.
The key level going forward will be $167. If that level can hold, then the uptrend will remain. Plus, with a recent close above $205, Square could rise as high as $280 in the months to come… There could be volatility in this stock before that happens, but I view that as an opportunity. I'll look to buy corrections that hold the $167 level.
These are just two of the stocks that I'm watching right now. With the signals I've shown you today, traders have plenty to focus on – and some exciting trading setups.
[Learn More: these stocks can quickly multiply in price 5x, 10x, 100x, or much higher…]
We should see even more chances to profit as December continues. Volatility may pop back up soon. And for traders, volatility equals opportunity.
We may be nearing the end of the year, and the end of the holiday season. But don't get complacent. As the old saying goes – money never sleeps.
Good investing,
Greg Diamond, CMT


