Where the charts say we’re going…
Faced with big international shocks such as China’s devaluation of its yuan, the first instinct is to try to work out where markets are headed. The political possibilities are endless. Almost all arguments from game theory, whether in favor of a terrifying escalation or of an imminent cessation of trade hostilities, sound plausible. These issues are important, but if we are not sure where we are going, it is best to look at the starting point.
This does not mean that the big international and policy questions of the moment do not matter. Of course they do. But concern about them can cloud the bigger picture.
How bad is the over-valuation in U.S. assets? I continue to believe it is serious, and it affects both stocks and bonds. I have written in the past, in another place, about a measure kept by Joseph Becker, a portfolio strategist at Milliman Financial Risk Management. It compares the total value of both U.S. stocks (via the Russell 1000) and U.S. bonds (via the ICE BofAML U.S. Aggregate, U.S. High Yield and U.S. Municipal bond indexes) to gross domestic product. This measure is at a record high. If anything captures the startling and continuing effect of central bank purchases in pushing up all asset prices in the U.S., this would be it:
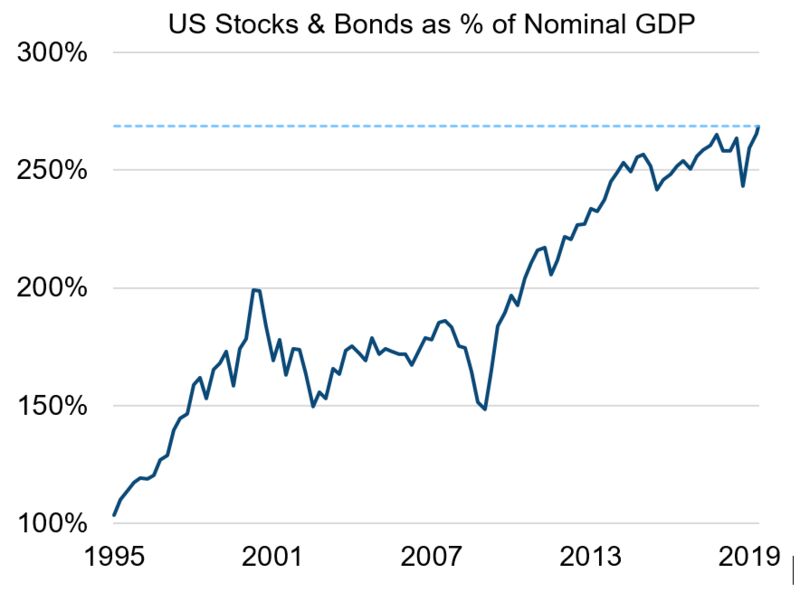
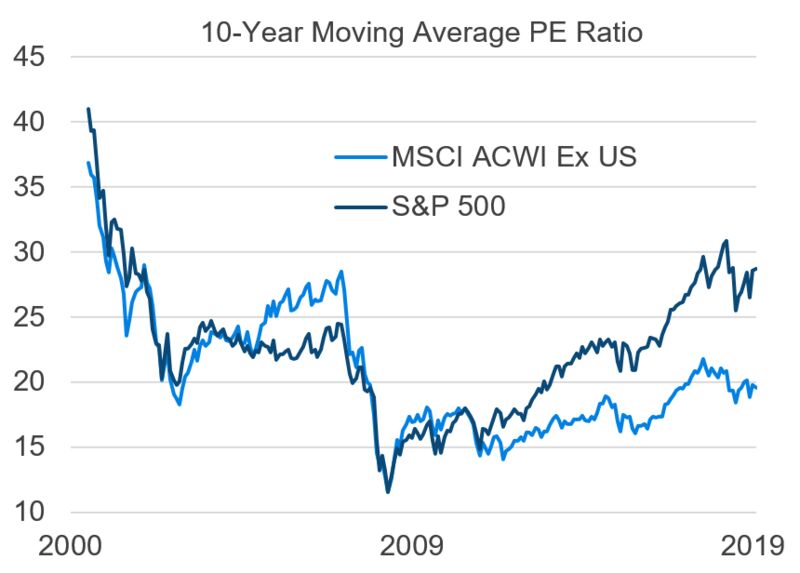
Milliman points out that this massive overvaluation is a U.S. phenomenon. Ironically, perhaps, it dates back roughly to the moment when Standard & Poor’s stripped the U.S. of its AAA credit rating in August 2011. Until that point, long-term U.S. stock valuations (comparing prices to a 10-year moving average of earnings, a simplified version of the famous Cyclically Adjusted Price to Earnings ratio), had moved in line with the rest of the world. Since then, the U.S. has moved steadily ahead:
Nothing about the recent round of political nerves, or about the general return of volatility since the sudden correction in February of last year, has done anything to redress high U.S. valuations compared with the rest of the world. The following chart shows the relative performance of cyclical and defensive stocks since March of 2018 as measured by Goldman Sachs Group Inc. chief U.S. equity strategist David Kostin:
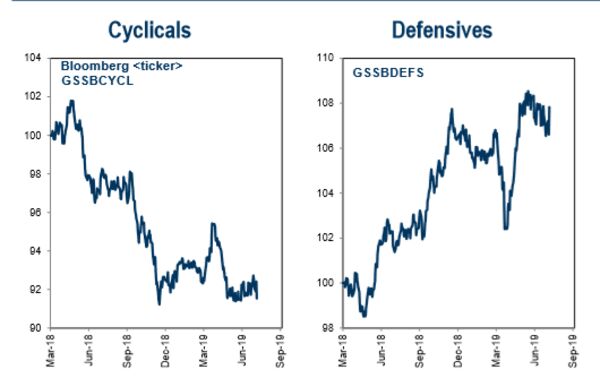
This is a classic equity market reaction to fears of an economic slowdown, with money flowing to defensives and away from cyclicals. Even in the context of a rising market, investors appear to be bracing for bad news from the economy. Meanwhile, here is the same exercise for how domestic stocks have fared against the S&P 500 relative to global stocks:
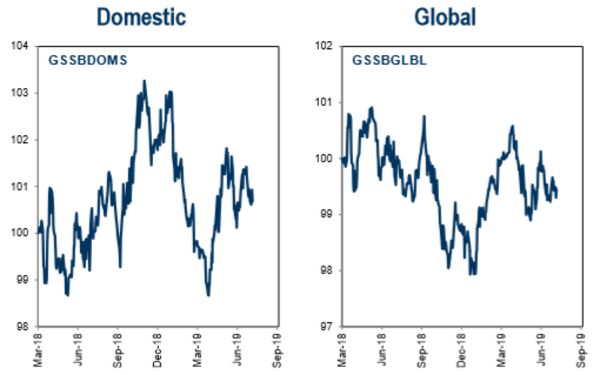
In short, geographic effects are minimal, and there is no great attempt to take advantage of the cheapness of stocks in the rest of the world compared with the U.S. And bear in mind that these charts were compiled before the news of the Chinese devaluation.
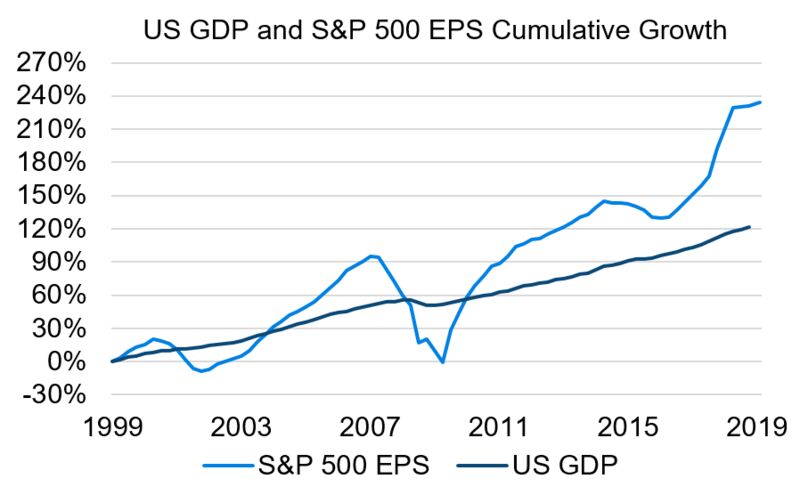
Why is the U.S. doing so well despite the concern about a flagging economy? Low rates obviously help, but these are a global phenomenon. Perhaps more importantly, earnings in the U.S. continue to look good. Indeed they are growing far ahead of economic growth. This chart from Milliman compares cumulative growth in S&P 500 companies’ earnings per share with economic growth:
Good earnings like this can excuse a lot of sins. But should we really trust those earnings? They have been compiled under generally accepted accounting principles, which allow companies to do a lot of smoothing to take account of one-off costs, depreciation of equipment and so on. There is nothing wrong with this in principle, but when GAAP accounts differ widely from the National Income and Product Accounts kept by the Bureau of Analysis, it should be taken as a red flag. The NIPA profits do not include such items as capital gains and losses or bad debts, so they do measure different things, but over a matter of years the differences should wash out and NIPA and GAAP profits should move roughly in a line. This is what has happened to S&P 500 GAAP profits compared with NIPA profits over the last quarter century, as compiled by Gaurav Saroliya of Oxford Economics:
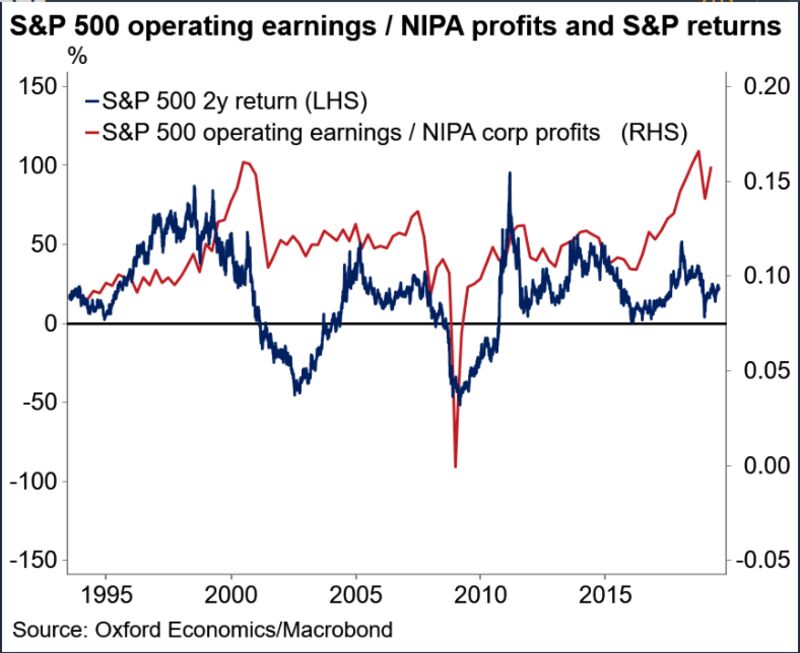
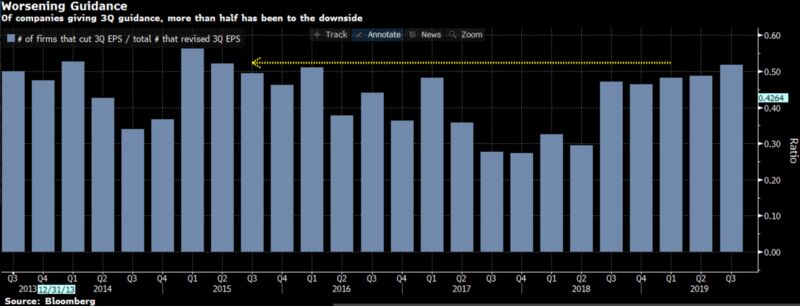
If the S&P 500 is racing ahead of NIPA profits at the fastest rate yet seen, that implies that we may have to worry more about earnings than about prices or the multiples. It begins to look as though earnings may be in some kind of bubble. This may be because of extremely cheap credit conditions or because of the historically strong position of capital compared to labor. This divergence in profit measures is, I suspect, more important than the latest ins and outs of the second-quarter earnings season. That said, with the season about 80% complete, we know that earnings are almost totally flat, and that companies are talking down their prospects at the greatest rate since early 2015 when energy companies were writing down their own estimates in the face of the falling oil price:
All of these valuation measures suggest that we might not be getting a bargain buying U.S. assets. For long-term investors this is important. But they tell us nothing about timing.
When it comes to long-term timing measures, the bond market is giving us a vintage signal for approaching trouble. Yield curves have been flat for a while. In other words, the amount by which long-term bond yields exceed shorter-term bond yields has been narrowing. There was further flattening during last week’s messy events, and the gap between 3-month and 10-year U.S. Treasury yields is inverted. This is a very strong recession indicator, as Cam Harvey of Duke University, and a consultant to Research Affiliates, makes clear:
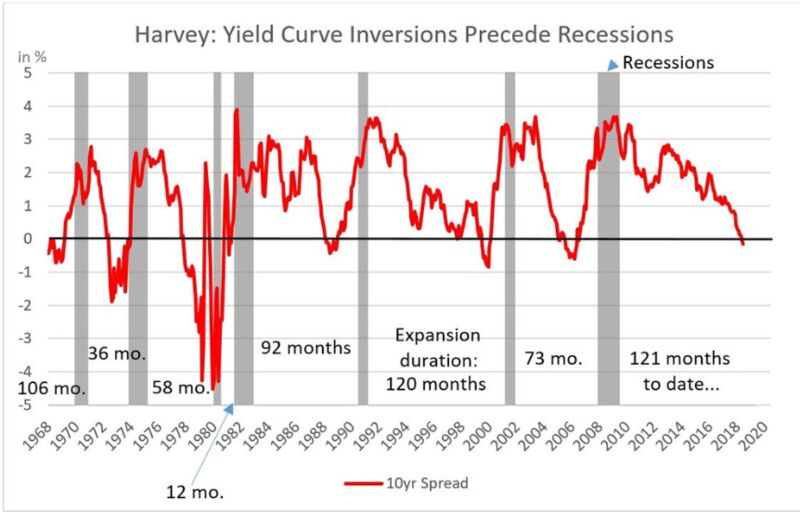
Is there any reason we should take this measure of the yield curve more seriously than others? Harvey argues that there is, because we want to measure the short versus the long term. As GDP is measured quarterly, a three-month yield is the shortest relevant yield, while the 10-year is the longest for which there is continuous data. Once an inversion has lasted for a full quarter, which this one has now done, then the odds of a recession grow very strong. There have been seven such inversions since 1968, and all were followed by a recession.
However, in all cases, the curve was no longer inverted by the time the recession started, according to official measures. This is a widely cited fact, used to suggest that investors should stay fully invested in stocks. This may be true for those trying to time the market precisely (never an easy or safe task), but in general, Harvey’s figures suggest that an inverted yield curve is almost as clear a negative signal for stocks as it is for bonds. This chart shows the average performance of the S&P 500 compared with Treasury bills, starting in each case from the beginning of the inversion, following the last seven inversions:
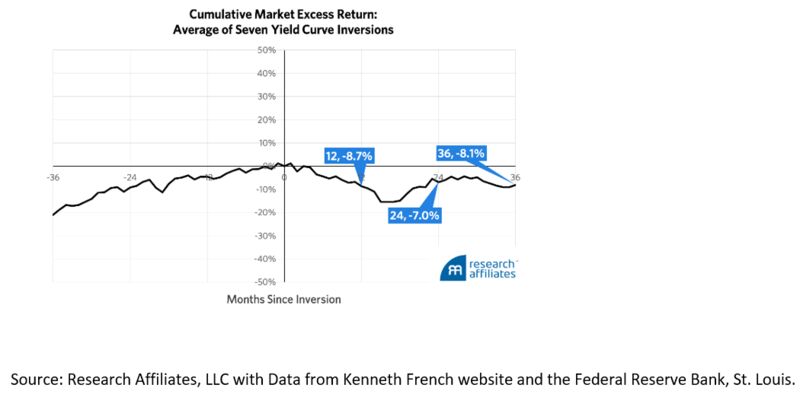
The yield curve tells us little or nothing about the severity of recessions ahead, and thus cannot tell us much about the dimensions of any sell-off in stocks. But it implies poor stock market returns for the next few years. Of that, there is no question.
So where does that leave us? U.S. stocks look overvalued, particularly compared with the rest of the world, and are based on earnings that appear to be overstated and face a troubled immediate future. A correction might be healthy. Stock and bond markets are both implicitly braced for recession, even though their overall valuations remain high. And a previously reliable indicator suggests a recession is on the way, bringing poor stock market performance in its wake.
Now, over to the politicians to see if they can find a way to avoid the rather alarming destination that the charts were showing even before the international situation took its latest twist.