As the new year begins, investors are wondering what the year ahead will hold. Will the U.S. stock market continue to break records? Or will we see a catastrophic correction and recession?
Everywhere I look, pundits are talking about the overvaluation of the stock market and the potential for market crashes ahead.
It’s true, the stock market has gone up a lot over the last couple of years. The Dow is up almost 97% from its pandemic low in March 2020. The S&P 500 is up 114% over the same time.
Yet, bull markets don’t end because they run out of buyers. They end when the liquidity that is fueling the speculation runs out or becomes much more expensive.
So today, we’ll take a look at one of the most historically reliable recession predictors – the yield curve spread.
And as you’ll see, it’s predicting a much more optimistic year than the talking heads right now…
What Is the Yield Curve Spread?
So, what exactly is the yield curve spread?
Broadly speaking, it monitors how expensive liquidity is. Let me explain…
The basic business model of the financial industry is to borrow money at a cheaper interest rate than it lends it out.
The easiest way to achieve this is to borrow on the short term and lend over the long term. That’s because typically, banks borrow money at low short-term rates and lend it out at higher, longer-term rates (mortgages, for example).
[Don’t Miss: Man Who Called 2020 Crash Warns of Huge Event in 2022]
The yield curve spread measures the difference between the 10-year Treasury yield and the 2-year Treasury yield. Each 0.01% is commonly referred to as a basis point.
Now obviously, the financial industry is a lot more complicated than this simple business model I’ve outlined, but that spread lies at the foundation of how lenders make money.
When short-term rates are low and potential returns from long-term investments are high, demand for credit rises. Investors borrow money at low rates and use it to speculate on things like stocks.
Usually, the first thing central banks do when there is a recession is cut interest rates. They do this to encourage borrowing and investment, in an effort to buoy up the economy and the markets. For example, during the 2008 recession, the Federal Reserve cut interest rates by 4%.
Of course, the opposite is also true. When central banks are worried about the economy overheating, or sticky (high) inflation, they raise interest rates. Eventually, short-term interest rates become more expensive than long-term rates. That means the spread becomes negative. That condition is referred to as an inverted yield curve.
And when the yield curve inverts, investors would be wise to take note…
Inverted Yield Curve Typically Signals Recession Ahead
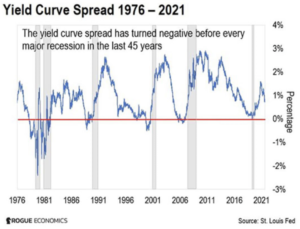
You see, the yield curve spread is the most reliable lead indicator of future recessions we know. As you can see from the chart below, it has moved into negative territory before every major recession in the last 45 years (shaded areas on the chart), including the pandemic panic in 2020.
[Exclusive: Marc Chaikin Reveals Biggest Stock Prediction of his 50-year Career on Wall Street]

The logic is clear. When the basic business model of the financial sector becomes unprofitable – when short-term interest rates become more expensive than long-term rates – banks stop lending.
Since bull markets thrive on liquidity, that removes a major source of new money for the economy. After that, it is only a matter of time before we get a recession.
And the nice thing about the yield curve spread is it gives us a long lead time to prepare for future trouble. It usually turns negative – inverts – anywhere from six months to two years before a recession.
For example, it inverted in December 2005, about two years before the Great Recession was officially declared. The previous time it inverted, it preceded the 2001 recession by 18 months.
[Game Changer: Log into Marc's $5,000 system today]
What Is Today’s Yield Curve Reading Telling Us?
Now, let’s take a closer look at how the yield curve spread looks today…
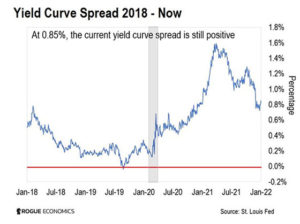
The current 2-Year Treasury yield is 0.78%. The 10-Year Treasury yield is 1.63%. That’s a difference of 0.85%, also referred to as 85 basis points.

The positive yield curve spread reading and historically long lead time for the signal suggest there is no reason to worry about the yield curve spread inverting in 2022.
My best guess is we won’t have to worry about a recession until 2024.
[Don’t Miss: Man Who Called 2020 Crash Warns of Huge Event in 2022]
These Assets Will Be Big Winners in 2022
As to what to expect in 2022… I’d be a buyer on any dip we see in the first quarter. With no recession in sight, there is plenty of scope for the market to continue to trend higher.
The S&P 500 gained nearly 27% in 2021. And history suggests that after a big year – 20% gains or more for the S&P 500 – there is a 70% chance the following year will deliver a solid positive return.
The stock market tends to rise aggressively both ahead of, and very shortly after, an inverted yield curve. That is when we can expect stock valuations to become very high and enthusiasm about the potential for the future to reach new heights.
In other words, the current market environment is exactly what we would expect from this stage in the cycle. We are likely to see even more enthusiasm expressed over the coming year.
Gold is also likely to be a big winner this year. The price peaked in August 2020 and has been trading in a volatile, sideways manner since. Technical analysts refer to this as ranging.
But gold has a history of volatile ranging, even when it is in a big bull market. During the 2000-2011 gold bull market, gold prices often went sideways for up to 18 months at a time.
I believe the mostly sideways action we have seen in the last 15 months is just a pause in this bull market for gold. I think gold is going to have a very good year in 2022.
And no matter what happens, we’ll be here every day to help you navigate this brave new world… and position yourself to profit.
All the best,
Eoin Treacy
Contributing Editor, Inside Wall Street with Nomi Prins
[Exclusive: Marc Chaikin Reveals Biggest Stock Prediction of his 50-year Career on Wall Street]
